The Seed Quality Challenge
The global seed testing market was valued at approximately USD 859 million in 2024 and is growing at a CAGR of 6.0% toward USD 1.45 billion by 2033. Producers face a dual challenge: demonstrating compliance with international phytosanitary standards while operating at the high throughputs modern packaging and distribution lines demand. Counterfeit and substandard seeds remain a persistent problem across major production markets including India, China, and sub-Saharan Africa.
Seed quality encompasses physical purity, genetic identity, germination viability, moisture content, pathogen burden, and the absence of weed or off-type contamination. Traditional laboratory methods evaluate each attribute in isolation and often sample only a fraction of a lot — introducing statistical risk that the final population may not reflect tested results.
| Failure Mode | Downstream Consequence | Regulatory / Commercial Risk |
|---|---|---|
| Varietal impurity / off-types | Yield reduction; hybrid trait expression failure | Certification withdrawal; lot recall |
| Weed seed contamination | Field infestation; quarantine species spread | Phytosanitary embargo; export ban |
| Low germination / dead embryo | Replanting costs; crop failure | Customer claims; brand damage |
| Fungal / mould contamination | Storage losses; mycotoxin risk | Health authority rejection; liability |
| Insect damage (weevil, borer) | Silent viability loss during storage | Undetected degradation; warranty disputes |
| Excessive moisture content | Accelerated deterioration; mould growth | Lot rejection at destination port |
Why Traditional Inspection Falls Short
Standard seed lot sampling protocols (ISTA, AOSA) test hundreds of seeds from lots that may contain millions. Even a statistically robust sample cannot guarantee population-level quality when defect rates are low but consequences are high — particularly for quarantine weed species or pathogen contamination.
| Traditional Method | Capability Limitation | Impact on Operations |
|---|---|---|
| Manual visual sort | 60–90% accuracy; fatigue-dependent; subjective | Inconsistent lot-to-lot quality; high labour cost |
| Germination test (ISTA) | Results take 7–28 days; destructive; sample-only | Lot decisions delayed; no 100% inspection |
| Grow-out purity test | Seasonal cycle required; resource-intensive | Unsuitable for in-process or inline use |
| Chemical / electrophoresis | Destroys seeds; expensive; specialist needed | Cannot be used for production-grade screening |
| Moisture meter (bulk) | Average only; cannot detect per-seed variation | Hotspots missed; storage losses not prevented |
| Colour optical sorter | Surface colour only; no spectral depth | Misses viability, internal damage, varietal impurity |
| Paper / blotter disease test | Labour-intensive; 7–10 day result turnaround | Cannot support real-time production decisions |
Human visual inspection accuracy may degrade by 20–30% after as little as one hour of continuous monitoring — a significant concern in multi-shift seed grading operations. Sampling limits, slow lab turnaround, and fatigue create a quality assurance gap that machine vision is well positioned to close.
Machine Vision Approach
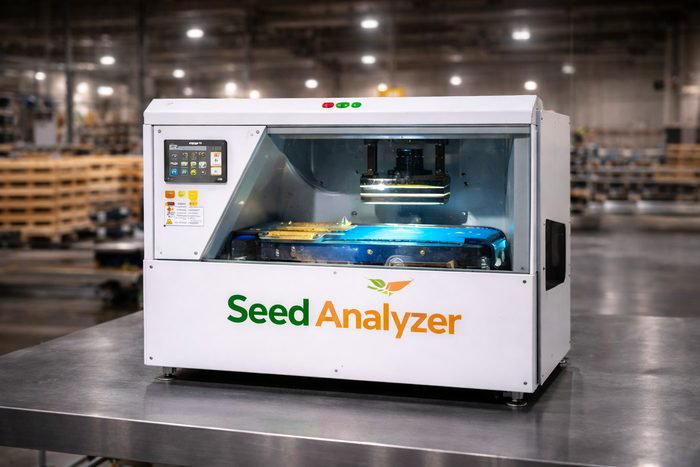
A multi-modal inspection architecture — combining high-speed RGB imaging, near-infrared hyperspectral sensing, and deep learning inference — addresses seed quality across the full attribute spectrum in a single production pass.
Station 1 — Pre-Sort Vision (RGB + Colour Grading): High-resolution line-scan cameras with multi-channel LED illumination (white, UV, and blue) capture per-seed images at throughputs of up to 1,200 seeds per second. Morphometric algorithms measure length, width, area, aspect ratio, and colour histograms to reject cracked, broken, shrivelled, and heavily discoloured seeds, plus preliminary foreign material and oversized weed seed removal.
Station 2 — Hyperspectral NIR Analysis: A push-broom hyperspectral sensor across the 400–1700 nm range acquires per-seed spectral signatures encoding chemical composition, moisture distribution, and structural anomalies invisible to RGB. Published HSI-CNN research shows classification accuracies exceeding 97% for maize defect detection and 93% for rice seed viability discrimination.
Station 3 — AI Grading, Purity & Traceability: A deep learning engine fuses morphometric, colour, and spectral features into a final per-seed verdict. Varietal genuineness detection using HSI with SVM/MLP classifiers has demonstrated accuracies of up to 99%. Every decision is logged with timestamp, station ID, and confidence for digital lot certificates and ERP/LIMS integration.
| Defect / Attribute | Sensing Modality | Indicative Accuracy | Classification Method |
|---|---|---|---|
| Cracked / broken seeds | RGB line-scan | ~97–99% | Morphometric rule + CNN |
| Mould / fungal staining | RGB + NIR HSI | ~95–97% | Colour anomaly + spectral CNN |
| Weed / foreign seed ID | RGB + HSI | ~96–99% | Multi-class DL classifier |
| Low viability / dead embryo | NIR HSI (900–1700 nm) | ~93–96% | HSI-CNN viability model |
| Insect / pest damage | NIR HSI | ~95–98% | Spectral cavity signature CNN |
| Varietal impurity detection | HSI full-spectrum | ~97–99% | SVM/MLP variety model |
| Moisture content (per seed) | NIR spectroscopy | R² > 0.95 typical | PLS regression model |
| Shrivelled / undersized seed | RGB morphometric | ~97%+ | Size/area threshold + CNN |
| Seed coating defects | RGB + UV fluorescence | ~96–98% | Colour/fluorescence CNN |
Expected Outcomes & ROI
For a mid-scale seed processing facility inspecting 2–5 tonnes of seed per shift, indicative payback on a multi-station machine vision system is estimated at 18–36 months, driven by labour savings, fewer customer claims, and improved lot utilisation.
| Outcome Area | Indicative Improvement | Business Driver |
|---|---|---|
| Purity inspection accuracy | From ~70–85% manual → >97% automated | Eliminate customer claims; protect brand |
| Inspection throughput | 100× faster than manual grading / sampling | Enable 100% in-line inspection vs. sampling |
| Labour cost reduction | 3–6 FTE inspectors replaced per shift | Payback typically 18–36 months |
| Germination test lead time | Predictive viability screen in <1 sec/seed | Faster lot release; reduced cold storage cost |
| Lot-level traceability | Digital per-seed record + lot certificate | ISTA / phytosanitary compliance readiness |
| False-reject (good seed waste) | System tunable to <2–3% false-reject rate | Preserve yield; reduce unnecessary downgrades |
| Varietal purity verification | In-process check vs. post-season grow-out | Compress quality cycle from weeks to seconds |
| Regulatory audit readiness | Timestamped image + data log per lot | Simplified OECD/ISTA cert; export compliance |
Implementation Considerations
Phase 1 — Feasibility: Sample seed lots spanning crop types, defect categories, and variety range are imaged and classified to establish baseline detection performance and generate training data that de-risks the capital decision.
Phase 2 — Supervised Production: The production system runs alongside existing manual inspection, enabling cross-validation of AI decisions and model refinement under real conditions.